SeoPoz SEO Dashboard is a small-scale analytics report that provides quick insights into what’s currently going on with your website. The dashboard consists of a set of widgets that display report excerpts from the most valuable SEO metrics.
An SEO Dashboard can be generated in a matter of seconds – all you need to do is create a Project. You can find SEO Dashboard on the top of the navigation menu “Dashboard” button. Choose one of your ongoing projects from the list or set up a new one.
Please note that using SEO Dashboard requires having at least one project on your list.
As you are directed to the dashboard you’ll see all available data for the selected project. This includes data from basic metrics like Domain Authority, Organic pages, Organic keywords, Organic traffic, Impressions and more. All of the website’s key metrics and tendencies will be found on this one page.

The data you see in each widget originates from a tool or report in the SeoPoz toolkit. If you want to get more detail, press the ‘View all pages’, ‘View all keywords’ or ‘View all countries’ button at the bottom of the dashboard. You’ll then be redirected to the corresponding tool or report.
The main Project Overview dashboard consists of:
- Basic metrics dashboard;
- Monthly organic traffic, organic pages, organic keywords, keyword ranking distribution charts;
- Top 10 organic pages dashboard;
- Top 10 organic keywords dashboard;
- Top 10 countries dashboard;
Basic metrics dashboard
This dashboard represents your monthly SEO traffic and compares it with the previous month. Also, you can see your website’s Domain Authority, Page Authority and Tracked keywords.
Monthly organic traffic, organic pages, organic keywords, keyword ranking distribution charts

These charts represents your monthly SEO traffic performance. You can see your monthly SEO traffic and how it changes during a month. Also you can see the monthly count of your ranked SEO pages and keywords. The last chart shows your keywords ranking distribution: Top3 ranked keywords, Top10 and Top30.
Top 10 organic pages dashboard
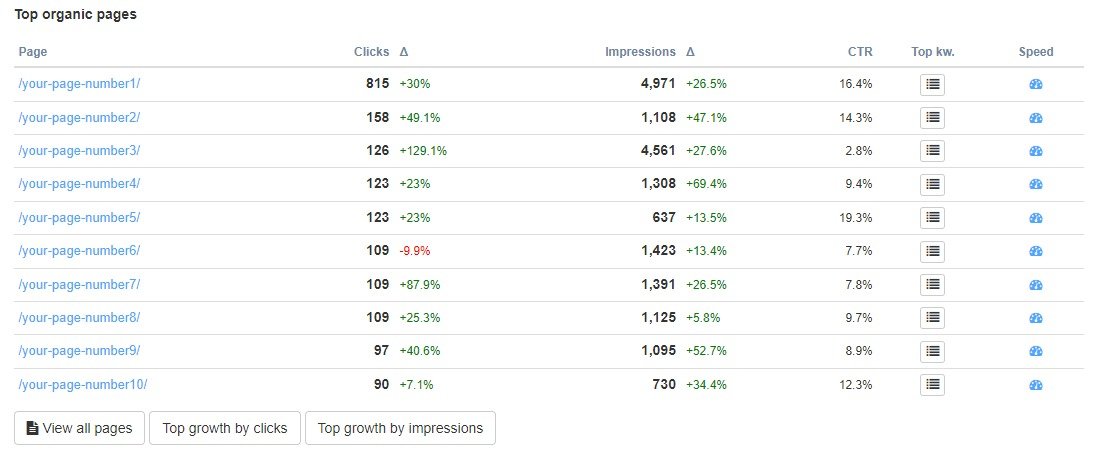
This dashboard represents the top 10 organic pages from which your website gets the most organic traffic. You can see Clicks, Impressions, Click Through Rate, and Top Keywords of each page accordingly. Every web page is compared with the previous time period, so you can easily check how your pages perform during the last month. If you want to see the all landing pages report, press the ‘View all pages’ button at the bottom of the dashboard.
Top 10 organic keywords dashboard

This dashboard represents the top 10 keywords from which your website gets the most organic traffic. You can see Clicks, Impressions, Click Through Rate of each keyword accordingly. Every keyword is compared with the previous time period, so you can easily check how your keywords perform during the last month. If you want to see the all keywords report, press the ‘View all keywords’ button at the bottom of the dashboard.
Top 10 countries dashboard

This dashboard represents the top 10 countries your website is performing the best. You can see Clicks, Impressions, Click Through Rate, and Top Keywords of each country accordingly. If you want to get the all countries report, press the ‘View all countries’ button at the bottom of the dashboard.
Help Us Improve
We are doing our best to tailor our tools and reports to meet our users’ needs. If you haven’t found the dashboard you need or if you would like to have more widgets at hand, please don’t hesitate to press the ‘Customer Support’ button on the right bottom corner.
Also, you can contact us by sending an email on the Contacts page. We promise to consider your feedback and continue adding more dashboards to support your needs.
Back to Knowledge Base